Setup
Virtual Machine
You can find the dedicated virtual machines for this course here. To access the page you will need to authenticate with your cs.curs.pub.ro credentials.
There are 2 virtual machines available:
- Lubuntu 24.04 (recommended for most students)
- Ubuntu Server 24.04 (recommended for Apple Silicon users, if the Lubuntu VM is too slow)
To log in, use the user student with the password student. The student user has sudo privileges.
Tools provided
Installed on the virtual machine are the following tools:
- gcc-multilib, gcc, nasm, make
- objdump, nm
- Ghidra, IDA
- pwndbg
- Text editors (vim, sublime, vscode)
- TeamViewer, tmate
- Python 2.7.18, Python 3.12.3
- Radare2
Running the VM
Windows / Linux / Intel Macs
Get the OVA file (PCLP2.ova). It can be imported in VirtualBox, as well as VMware.
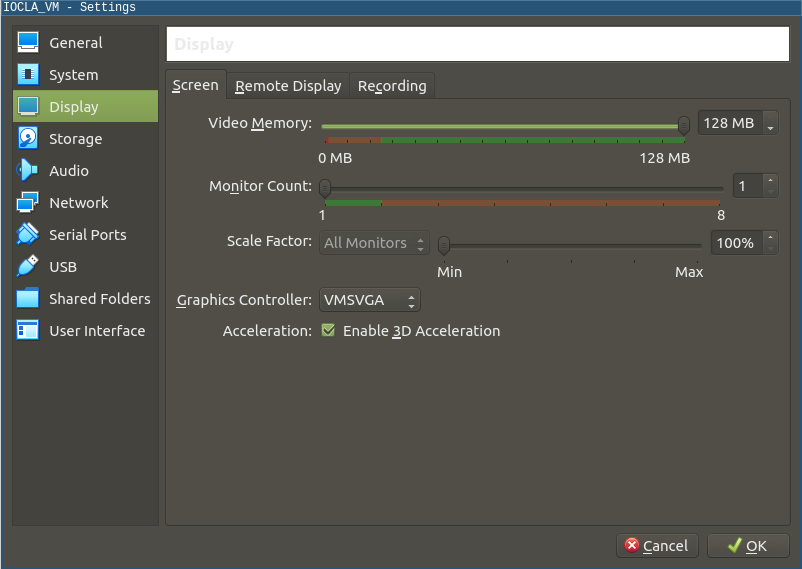
Using VirtualBox, you may need to set the graphics controller to
VMSVGA
Apple Silicon Macs
Since VirtualBox and VMware do not support emulating x86 on M series Macs, you will need to use the UTM app to run the VM. After downloading the UTM.dmg file, open it and drag the app to the Applications folder.
UTM does not support importing OVA files, so you will need to download and use the virtual machine in the qcow2 format.
PCLP2.qcow2for Lubuntuubuntu_server_pclp2.qcow2for Ubuntu Server
Since the virtual machine will be emulated, it will experience a significant performance drop compared to running natively on an x86 host. Thus, if you find the Lubuntu VM too slow, we recommend using the Ubuntu Server VM.
Use the following tutorial to import the virtual machine in UTM:
-
Click on
Create a New Virtual Machine: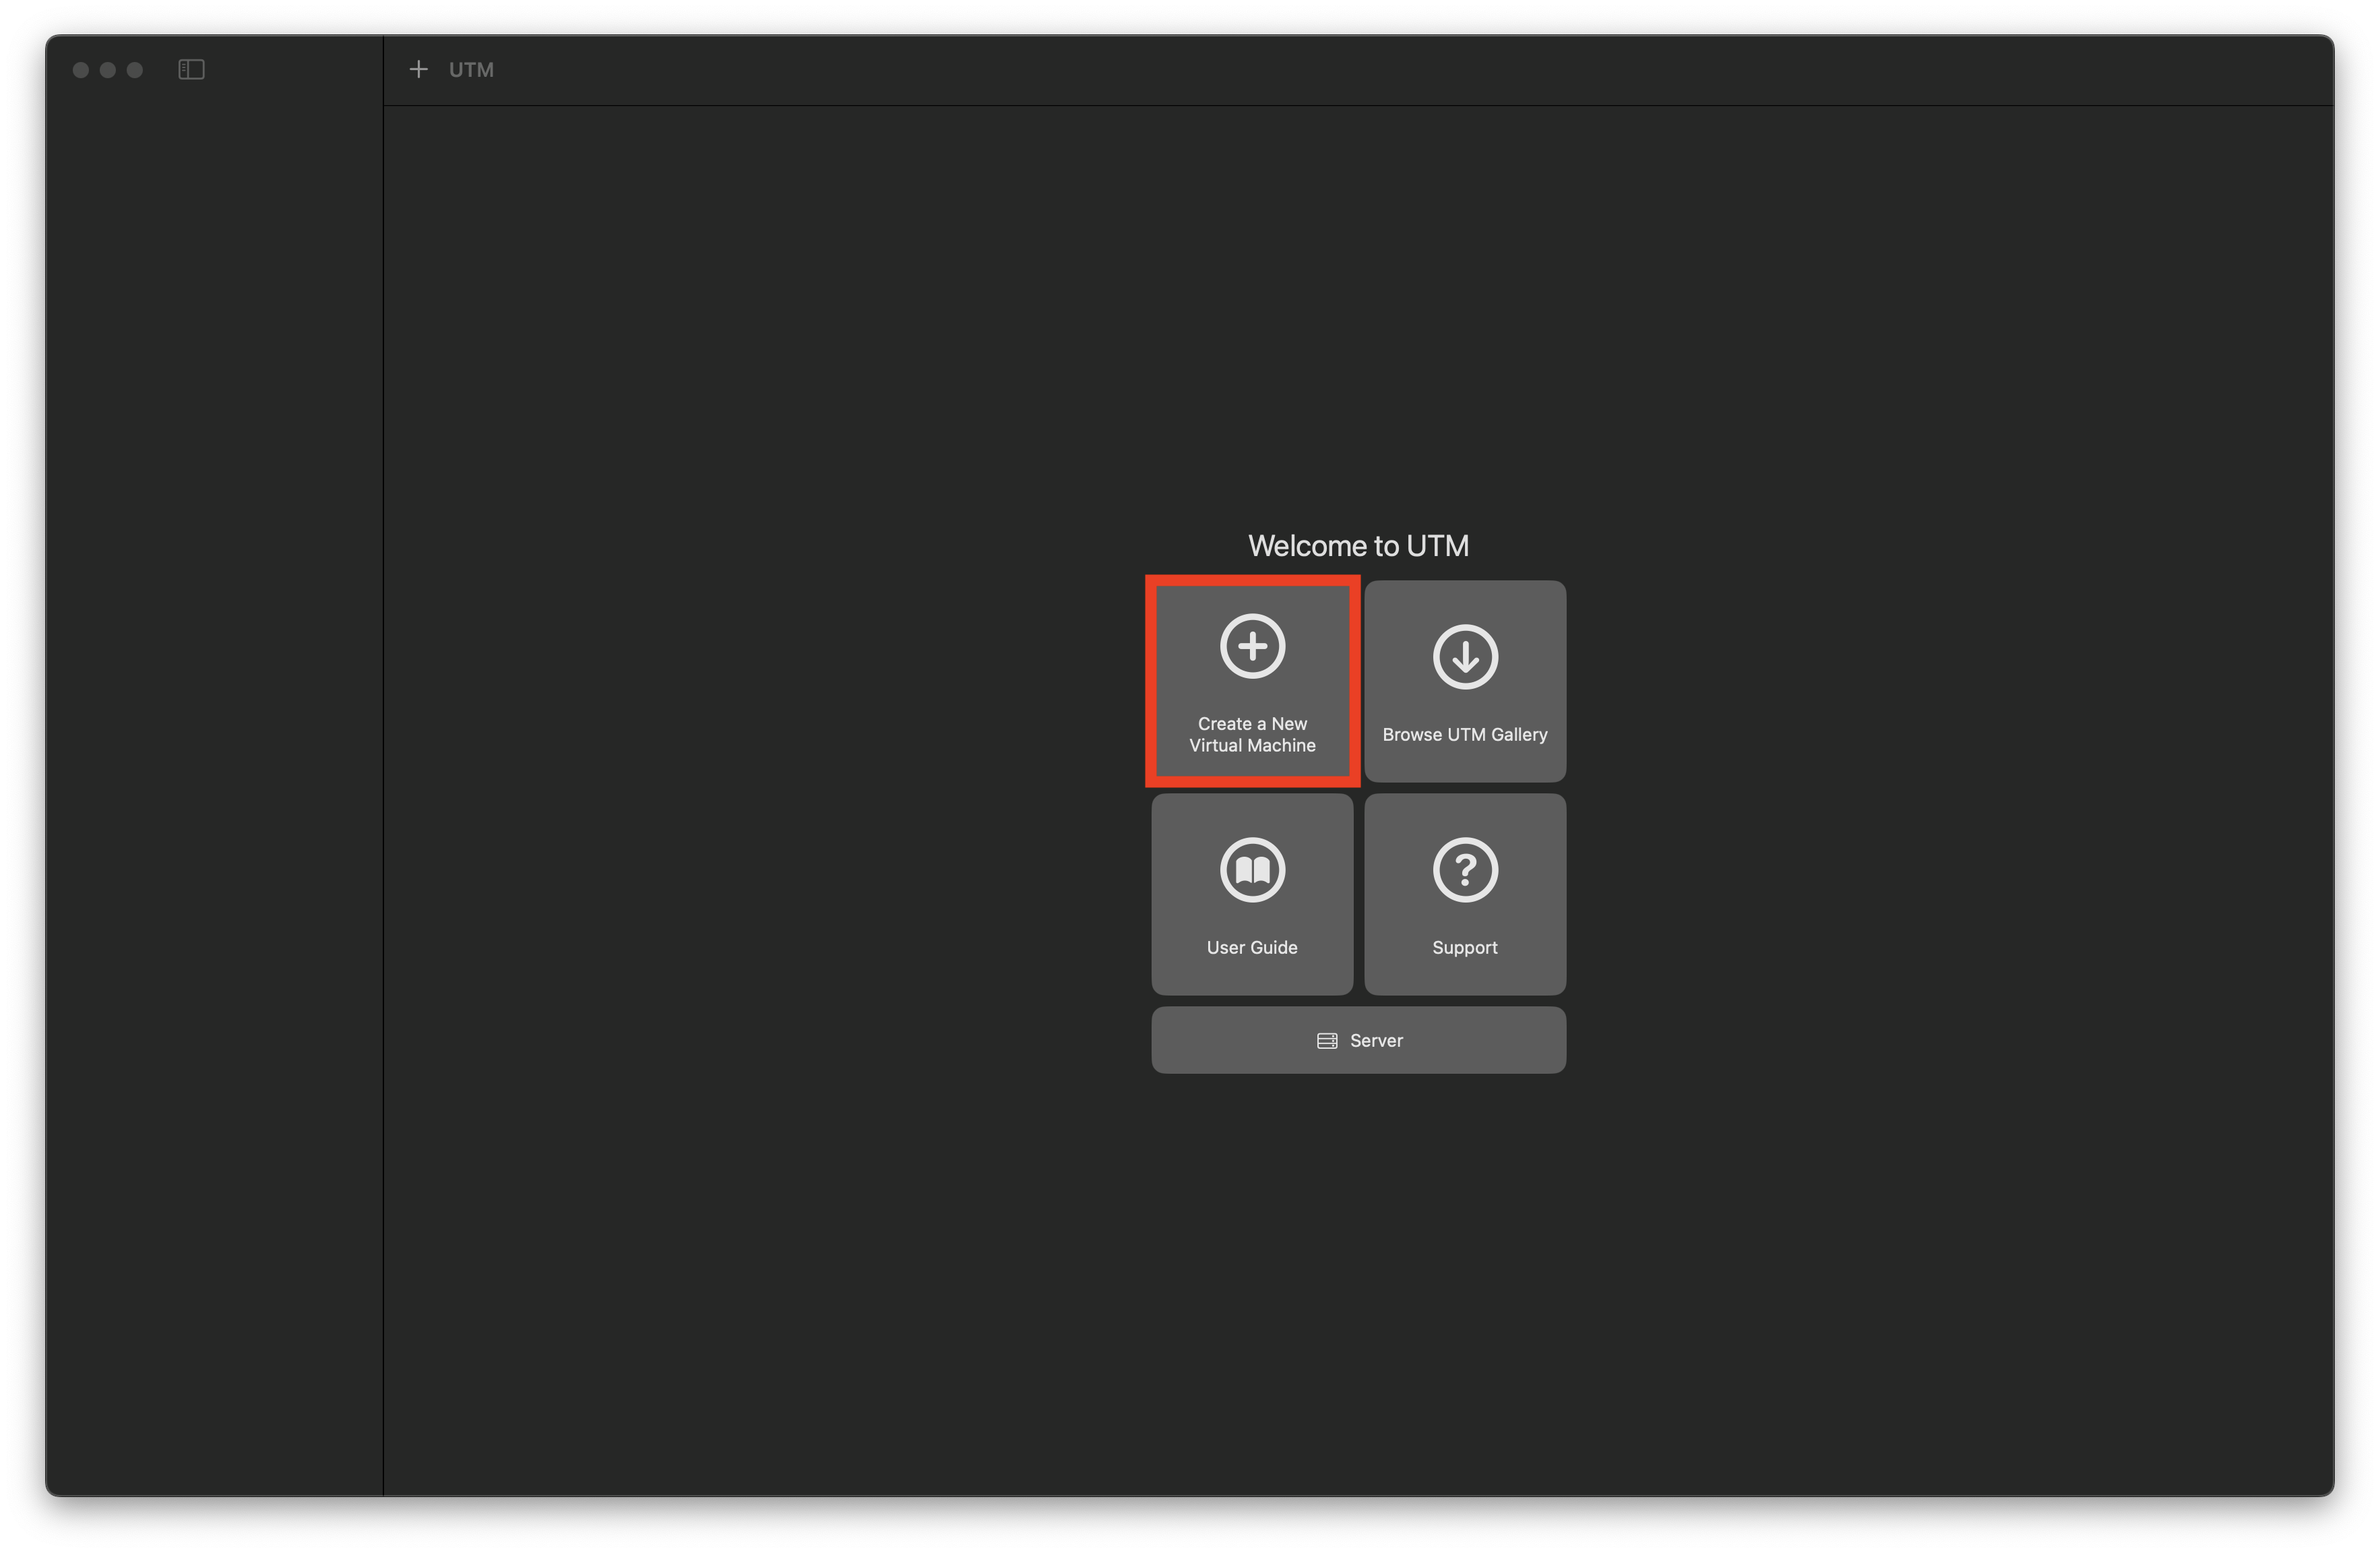
-
Select
Emulate:
-
Select
Other: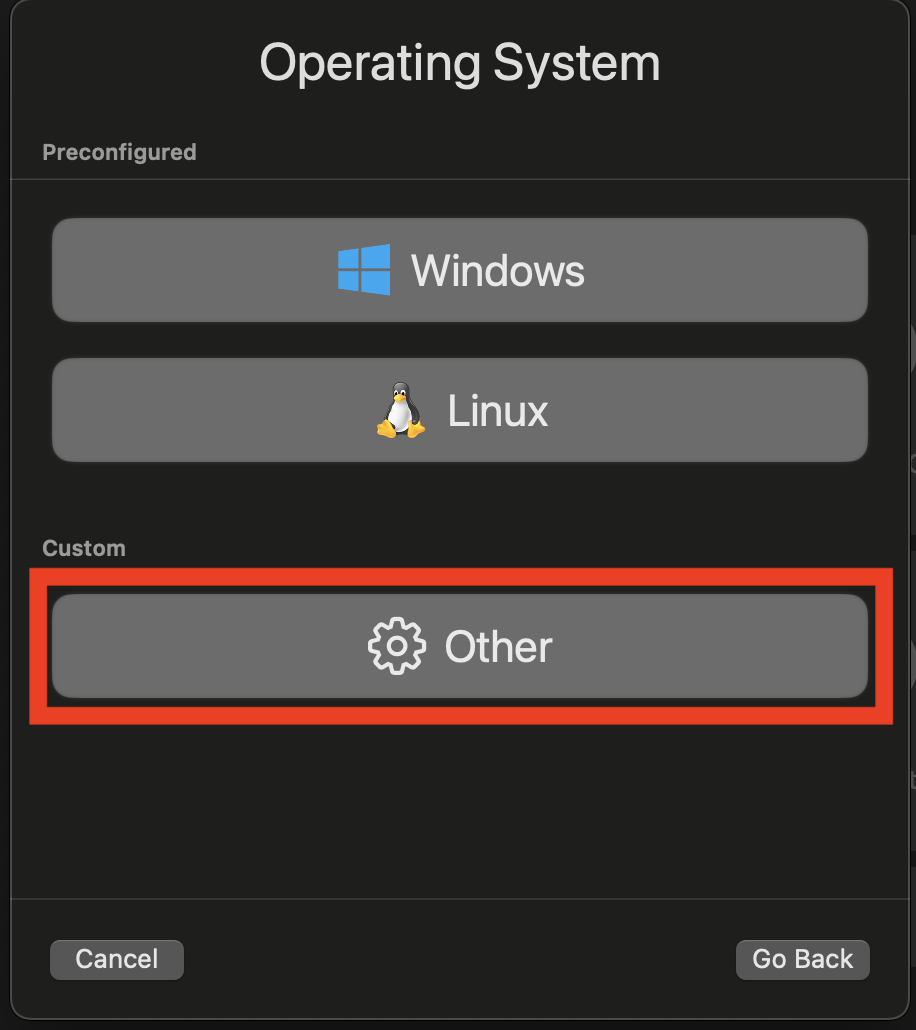
-
Check
Nonefor the boot device: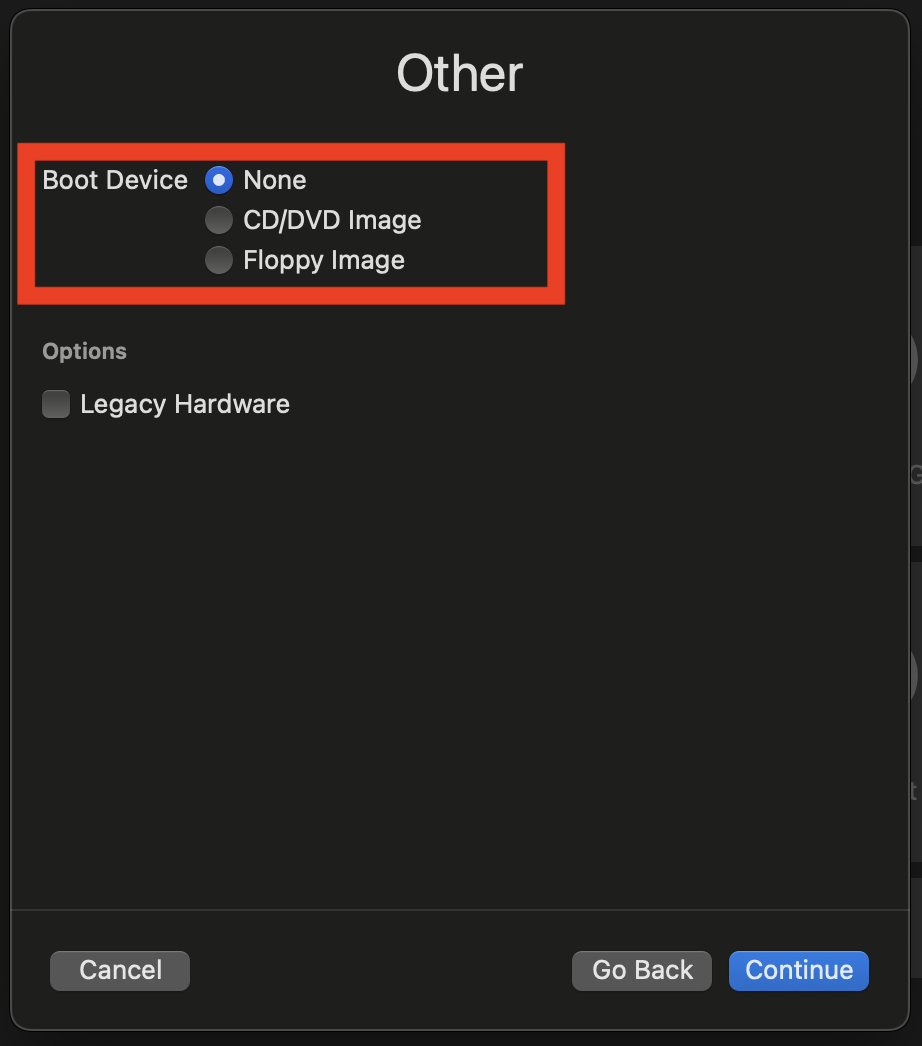
-
Allocate RAM to the VM (recommended 4GB):
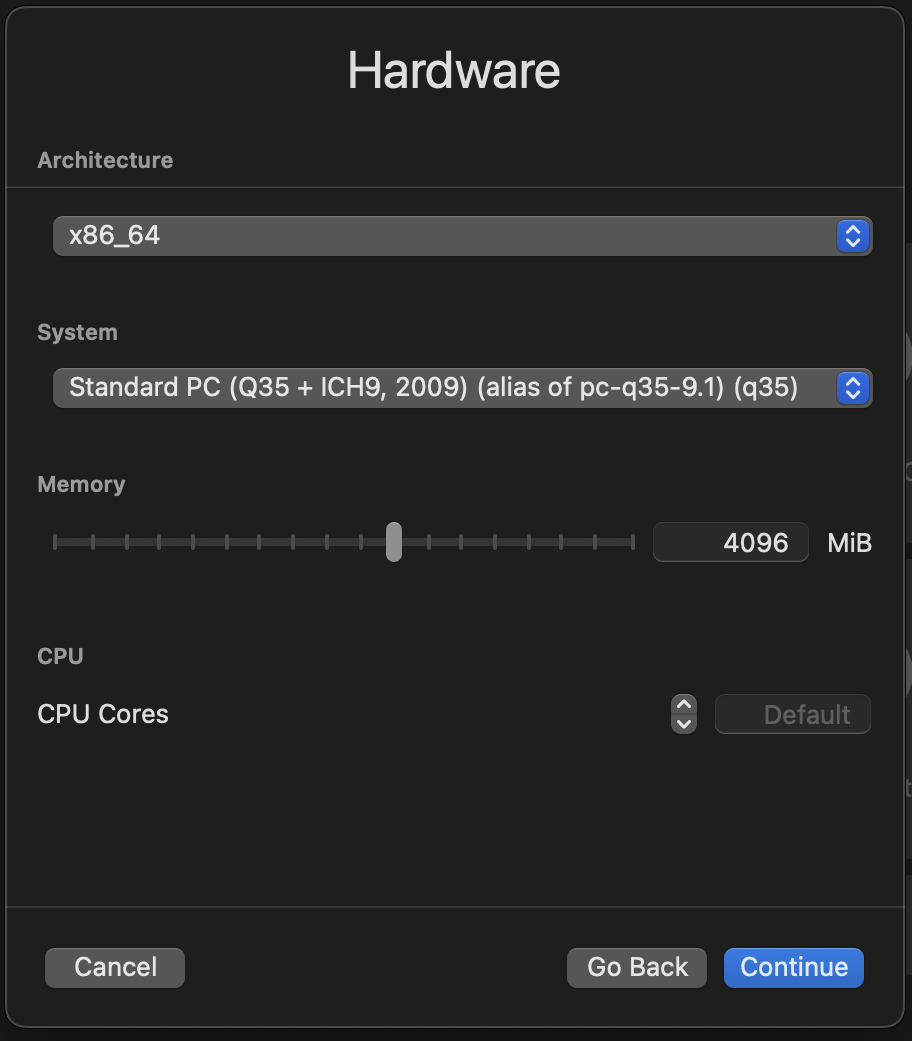
-
Set storage size (minimum 20GB):
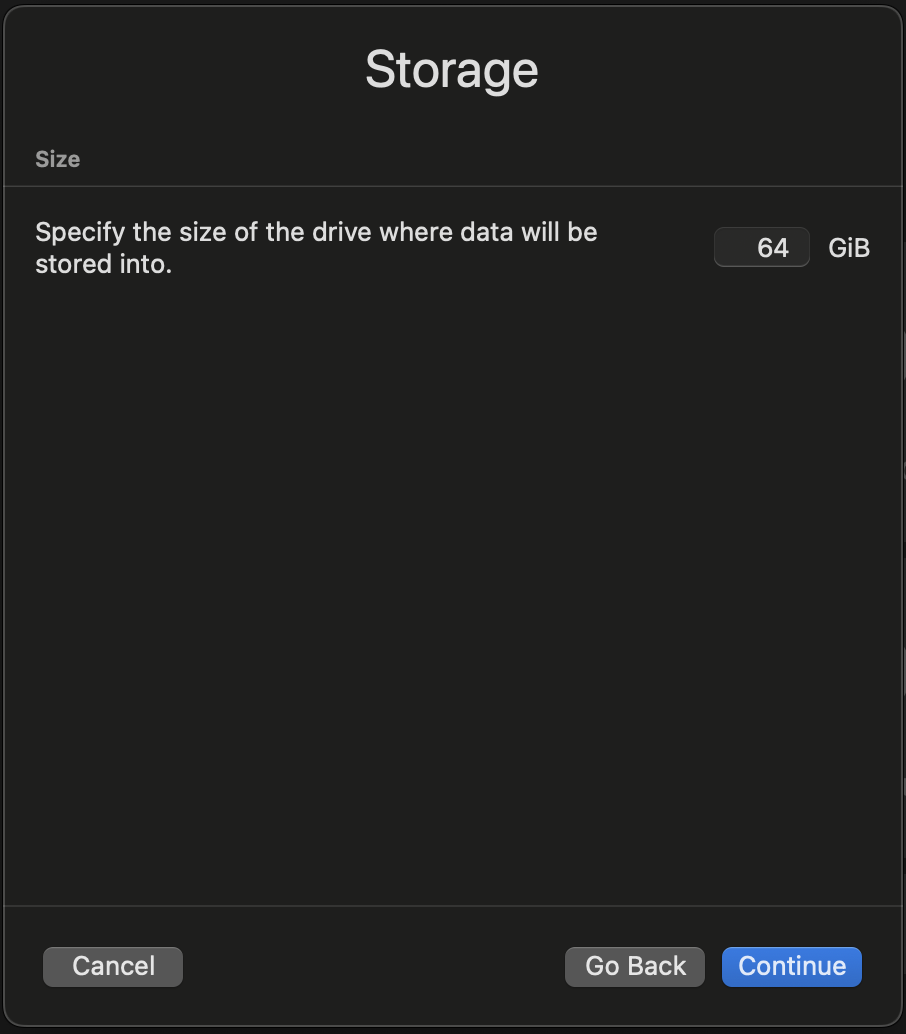
-
Skip shared directories setup:
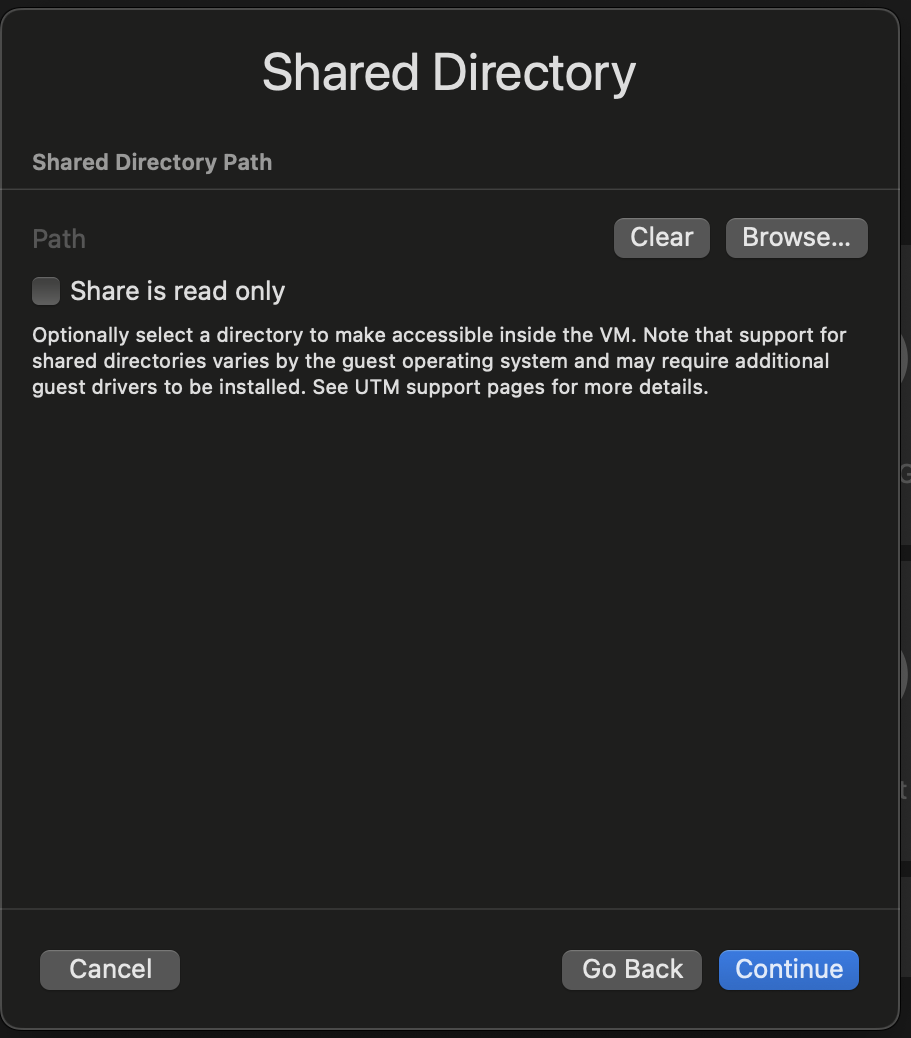
-
Name the VM:
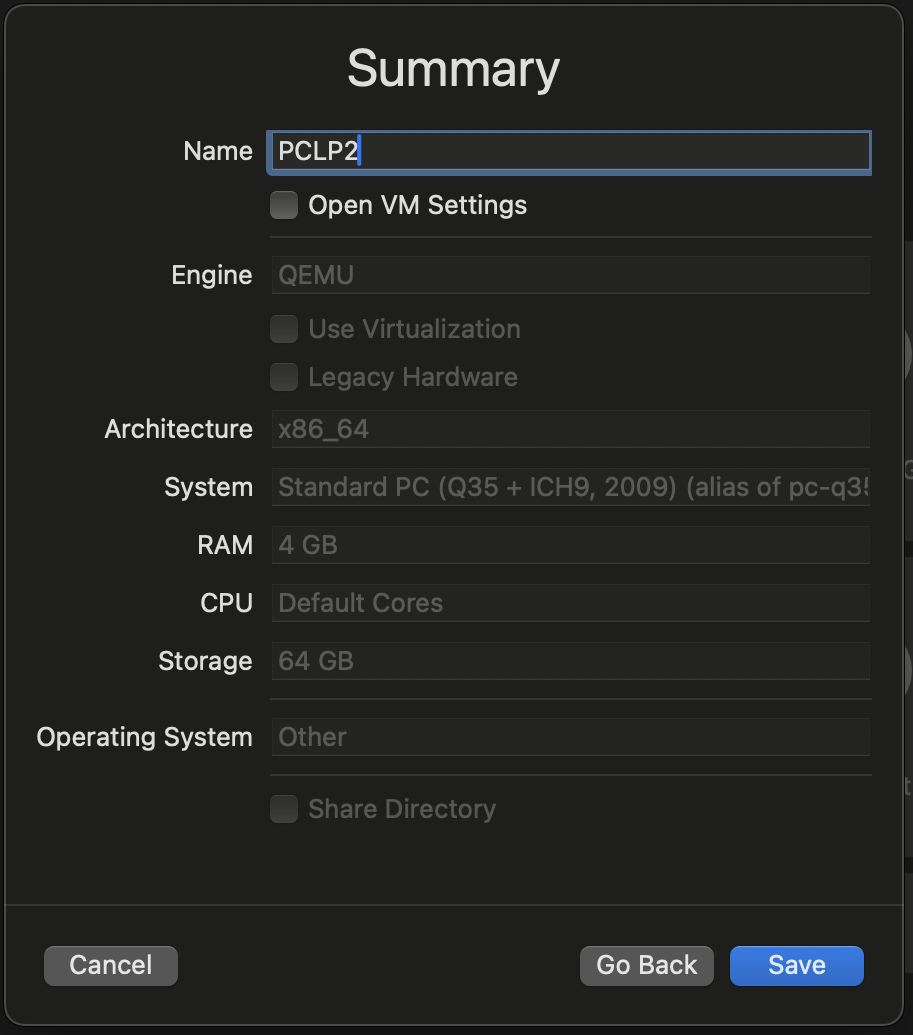
-
Right-click on the VM in the sidebar and select
Edit: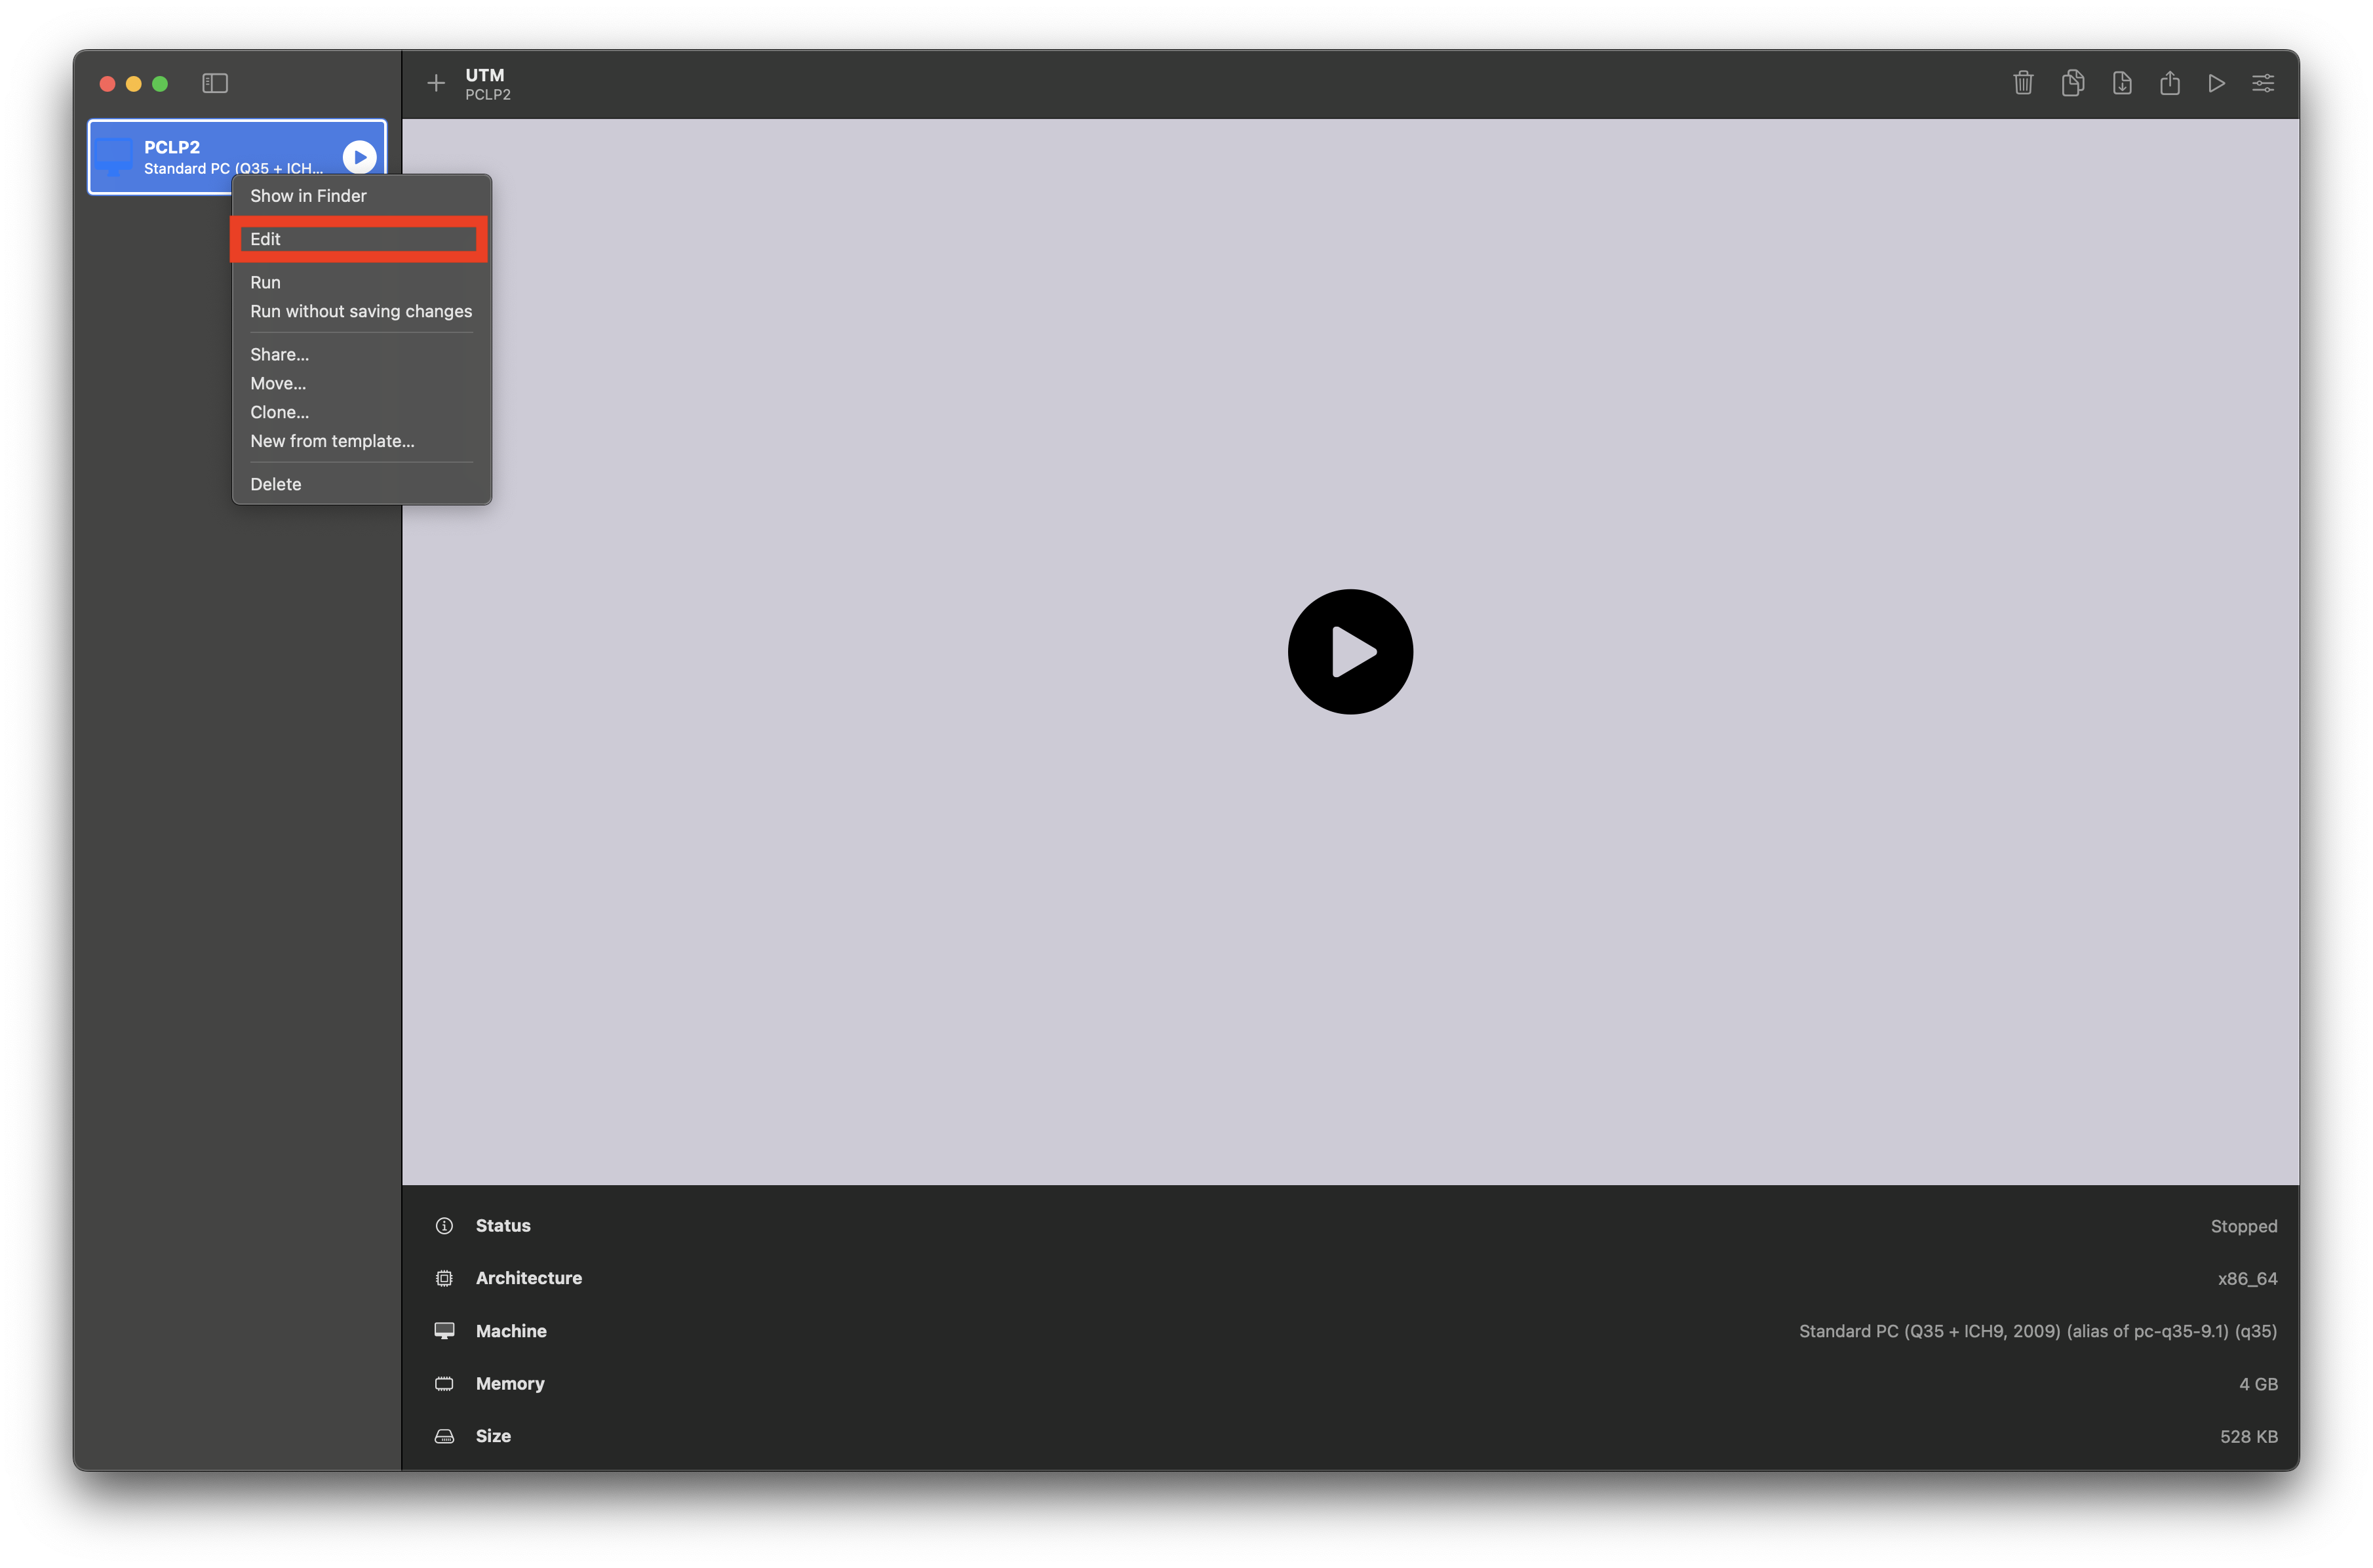
-
Go to
QEMUand disableUEFI boot: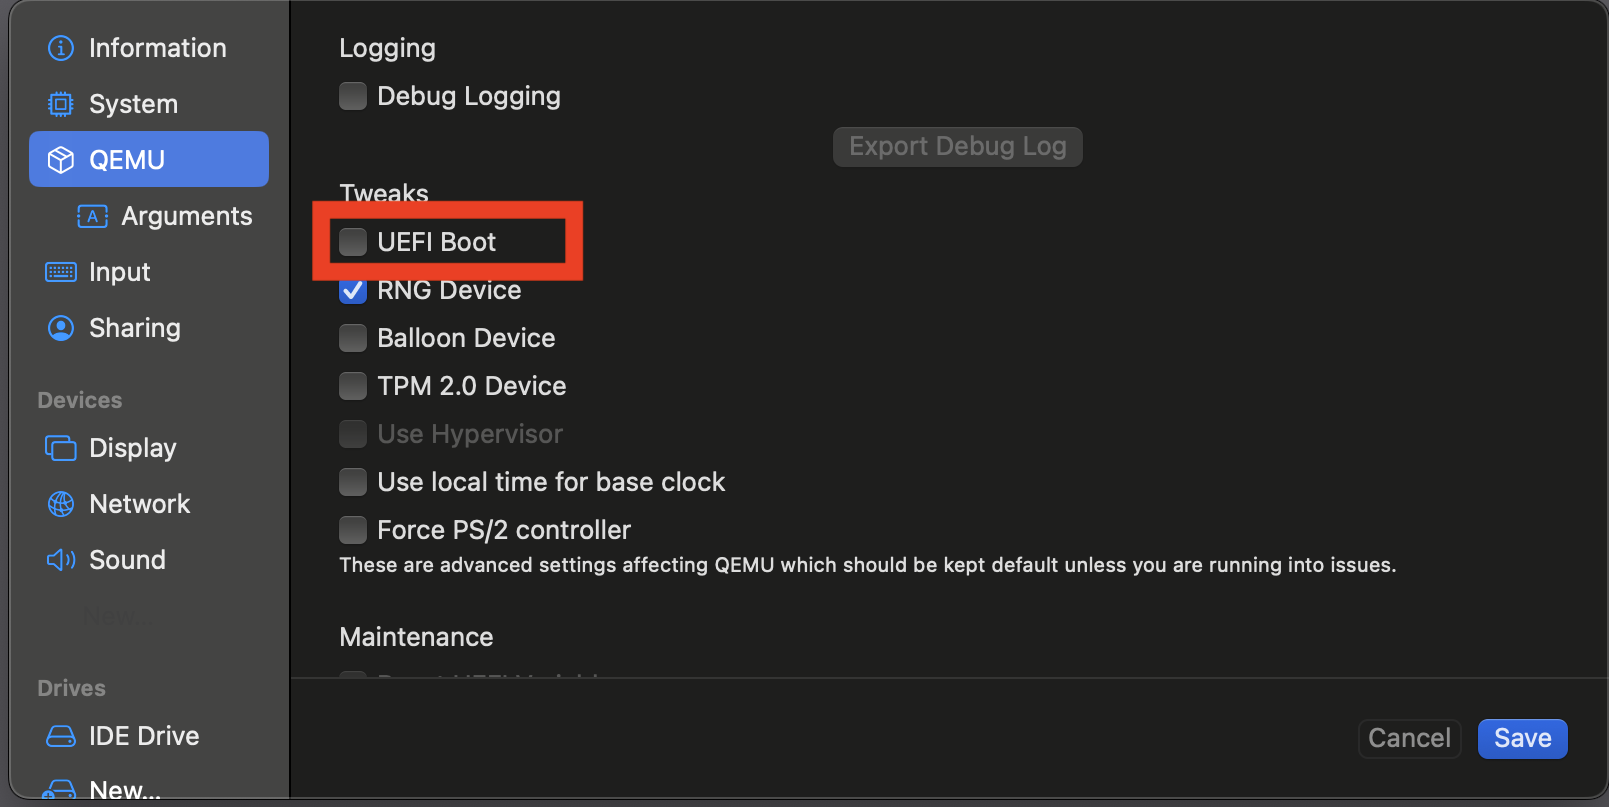
-
Go to
Drivesand selectNew..., then clickImportand select theqcow2file: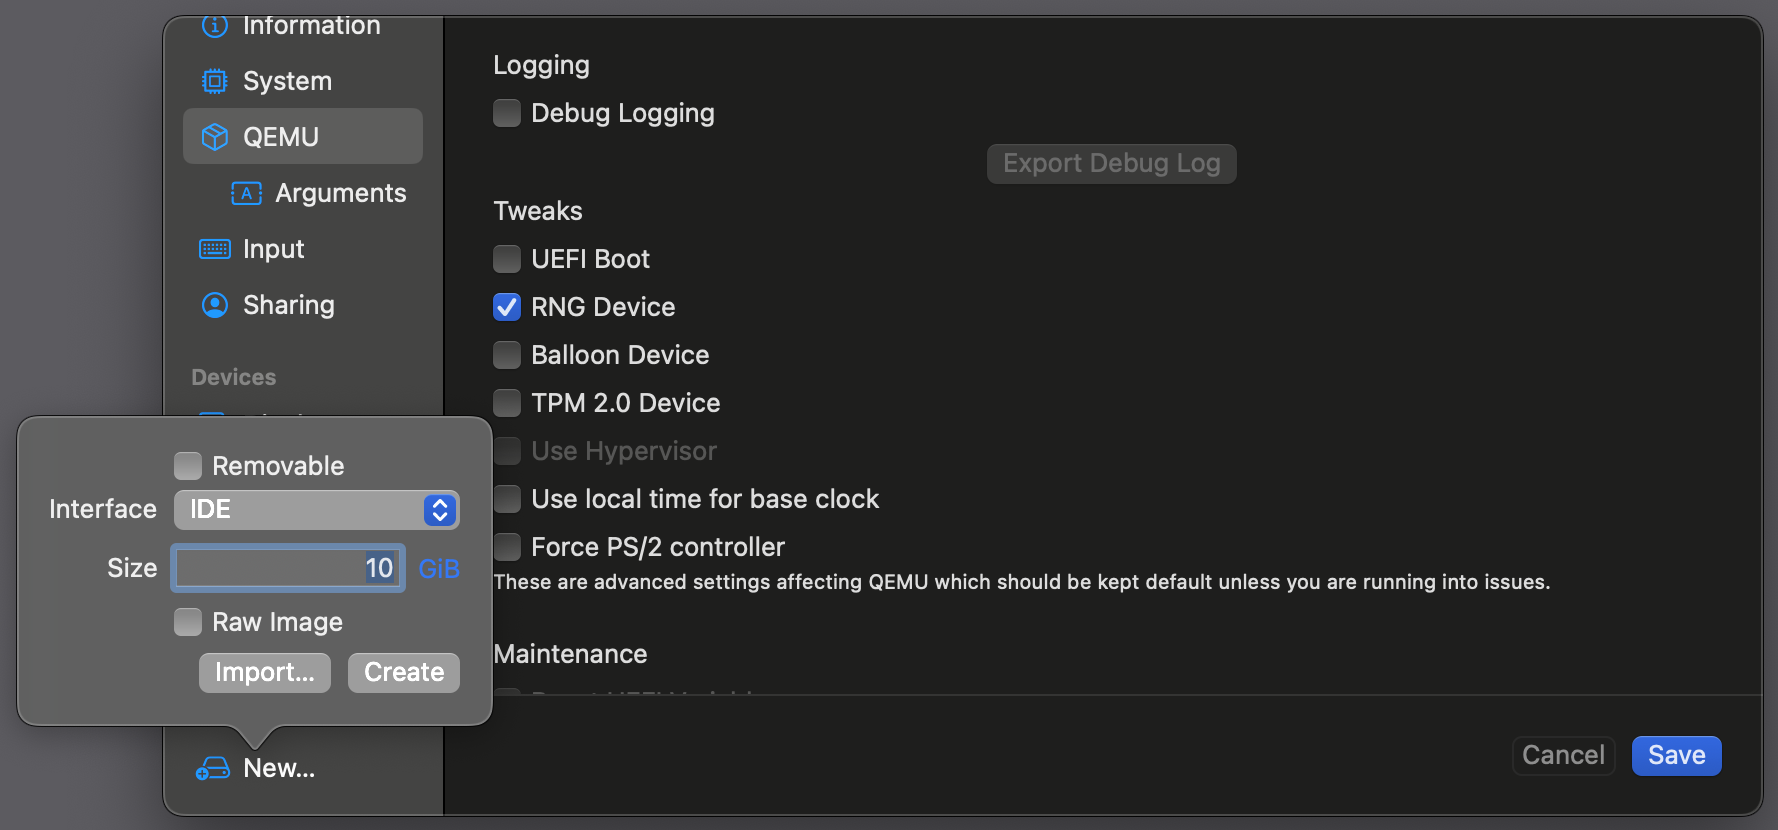
-
Right-click on the newly added drive and click
Move up: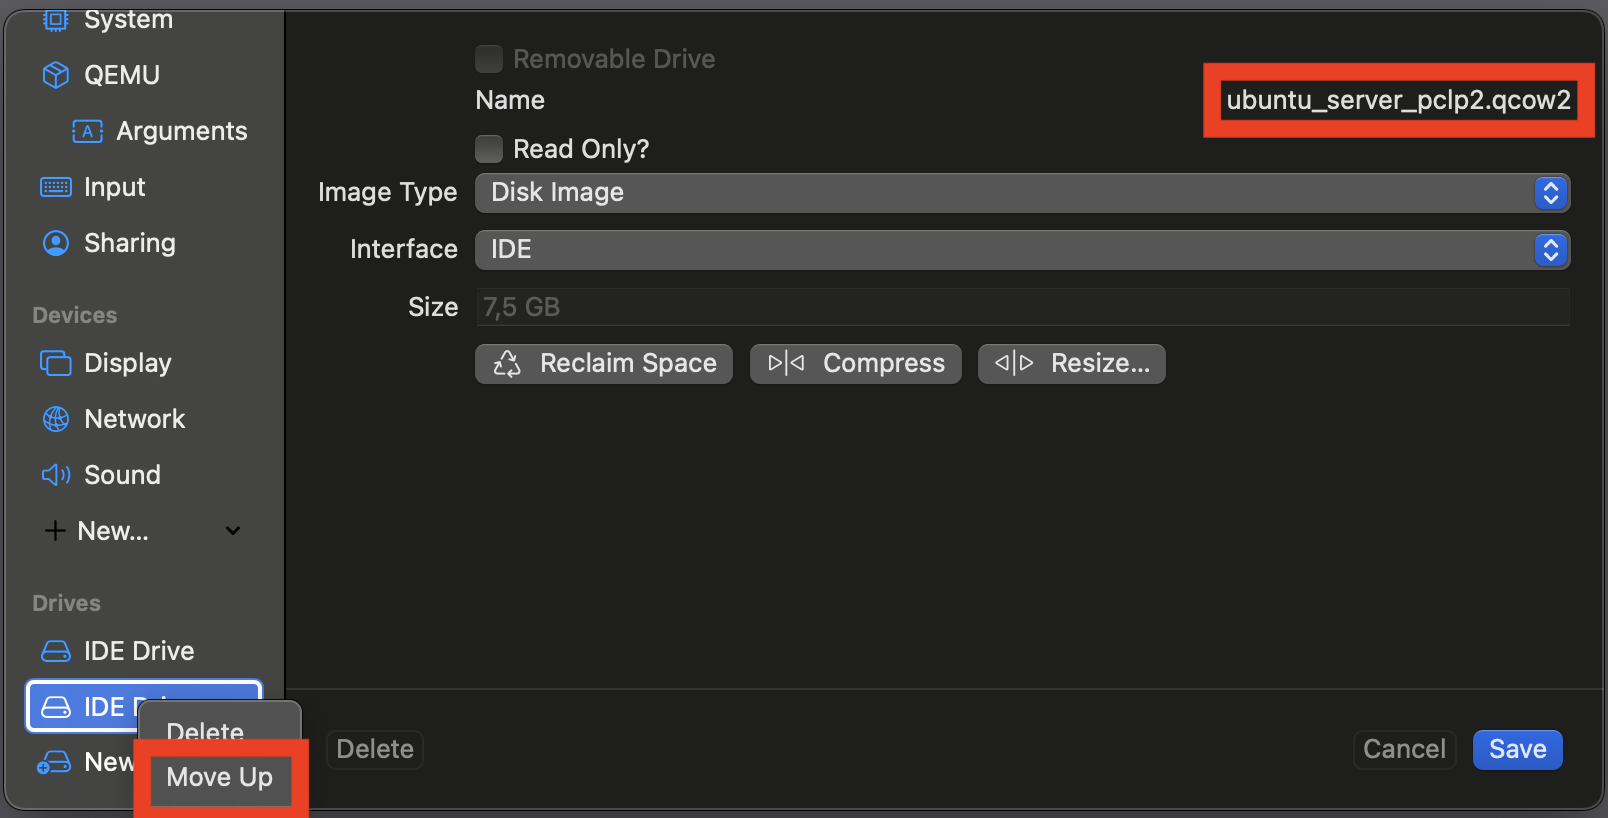
-
Save the edits and start the VM
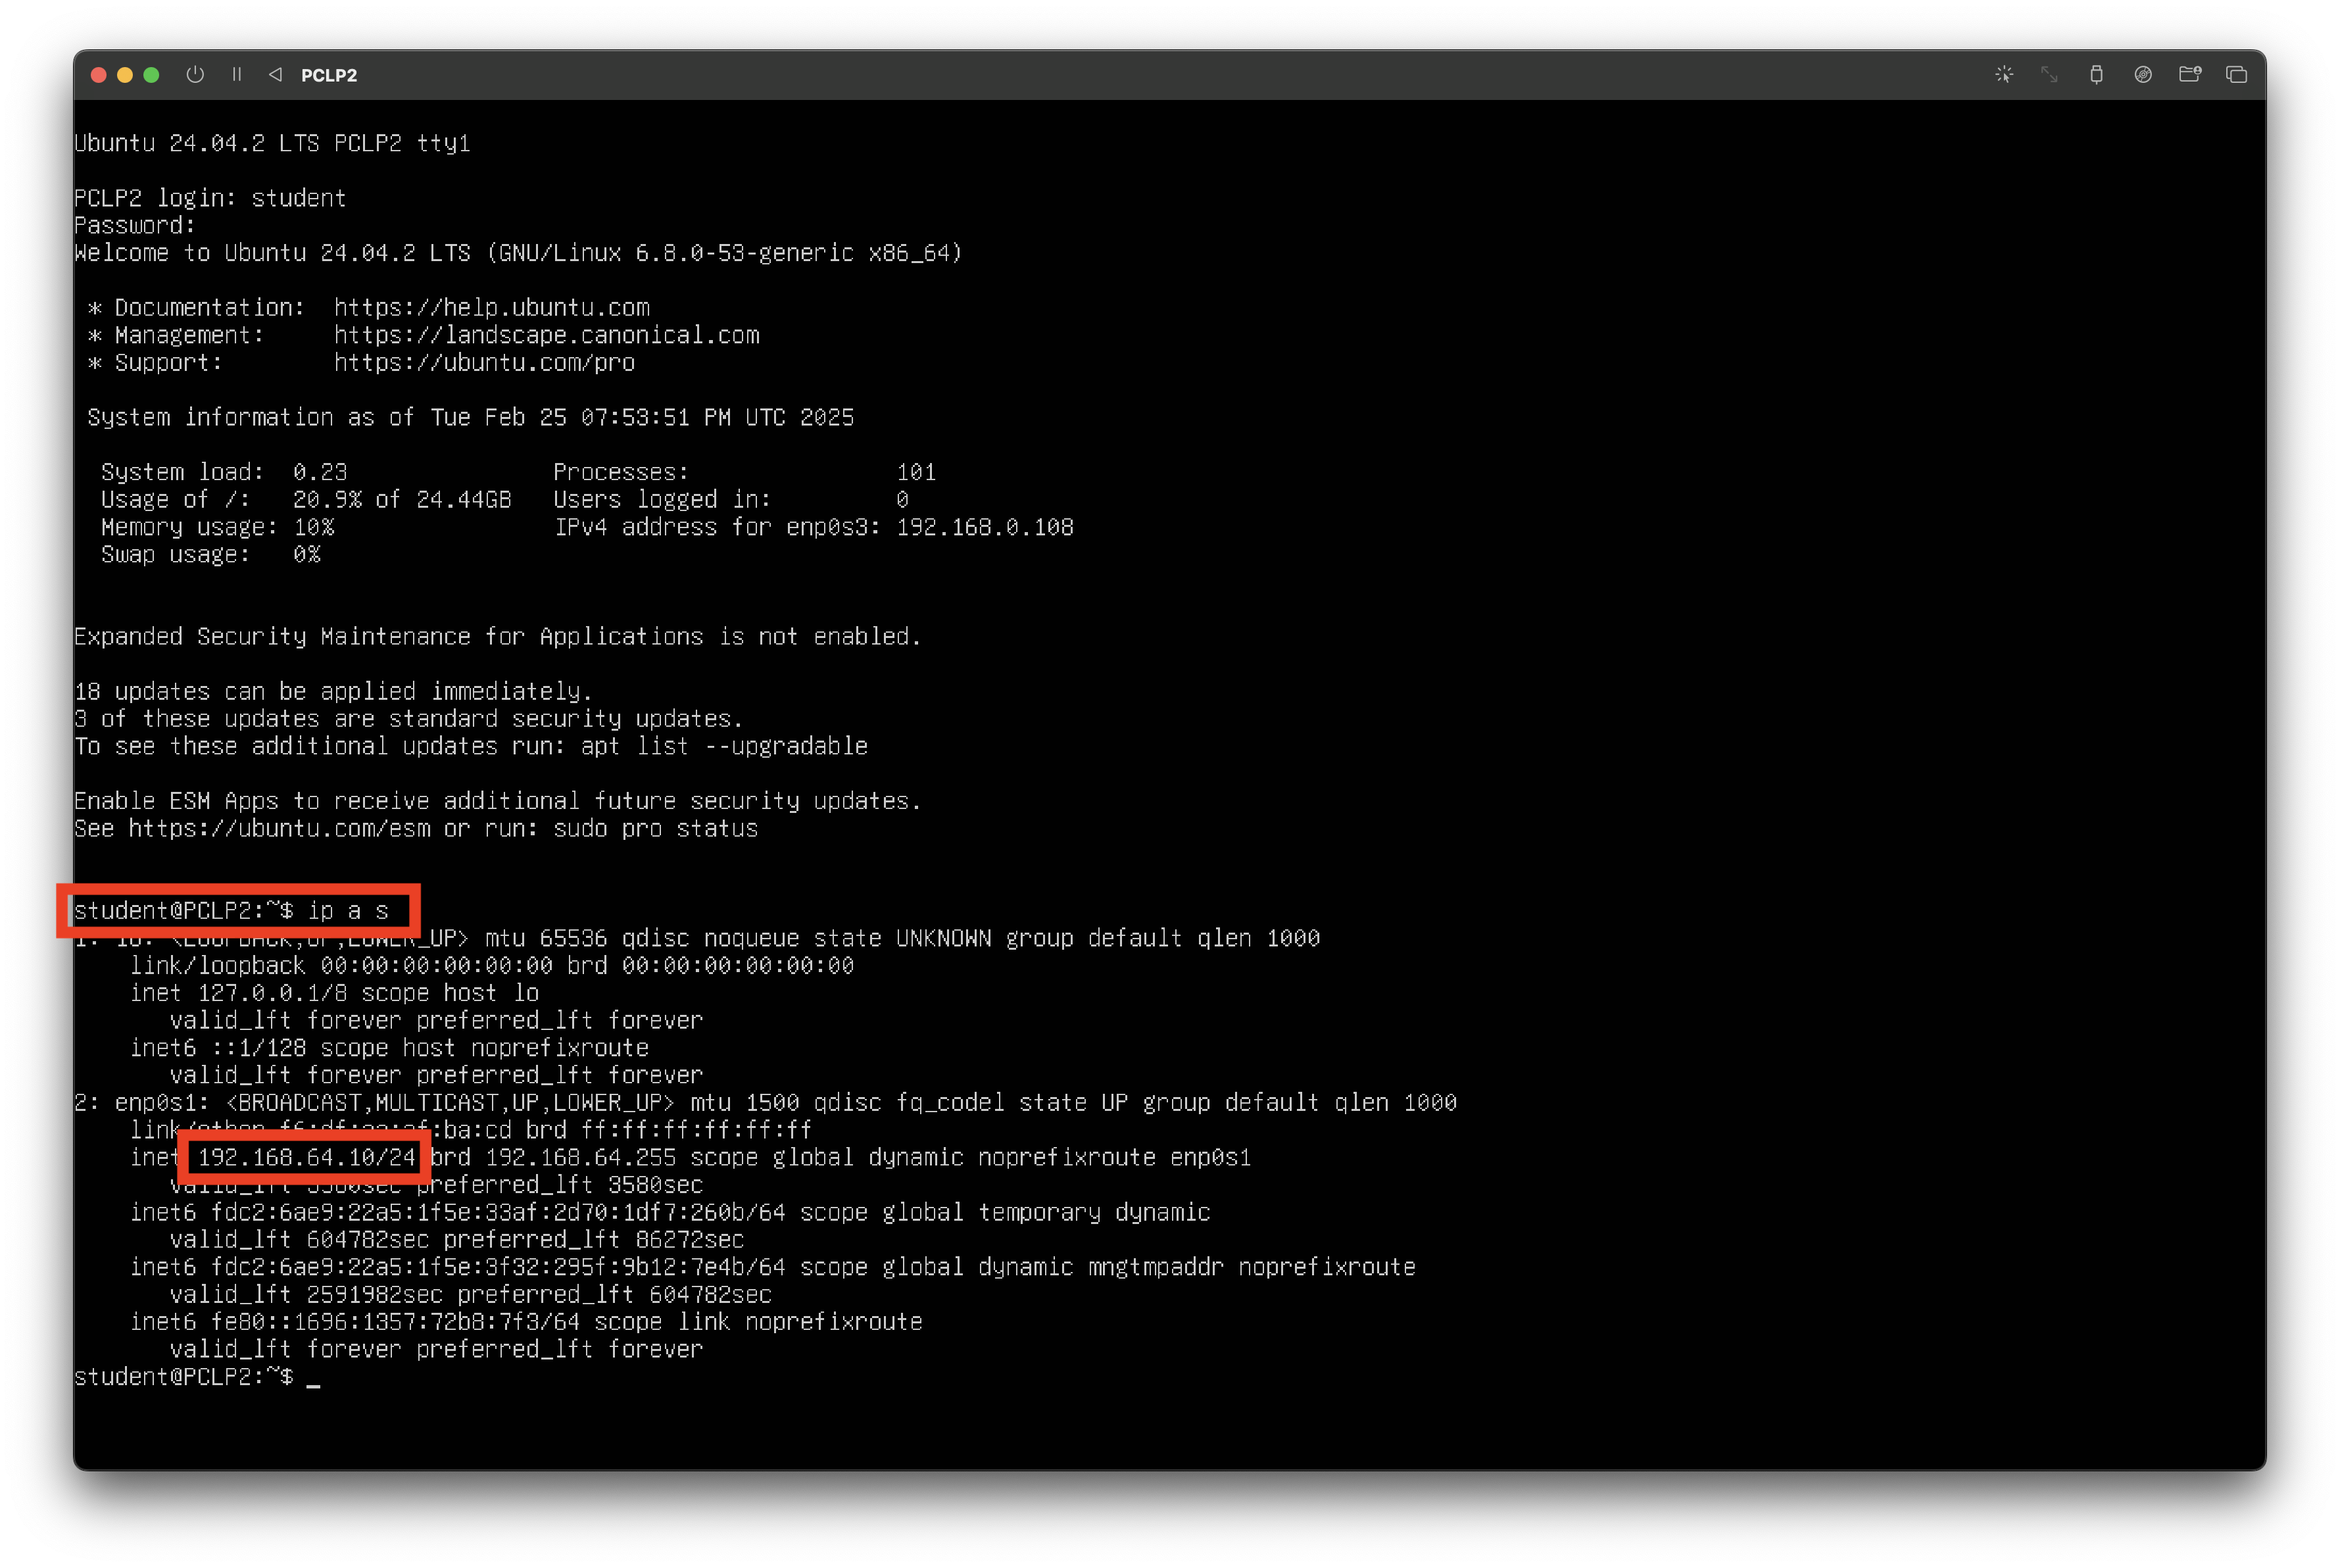
The Ubuntu Server VM has an SSH server opened on port 22. You can connect to it from your host machine using the terminal or the VSCode SSH extension.
After starting the VM (it may take up to 2 minutes), you can find its IP address by running
ip a s.
VSCode - GDB Integration
Configuration
Extensions to Install and their IDs
-
Makefile tools (microsoft)
ms-vscode.makefile-tools -
x86 and x86_64 Assembly (
13xforever);language-x86-64-assembly -
GDB Debug (
DamianKoper);gdb-debug -
From vscode menu:
Terminal/Configure Default Build Taskedit .vscode/tasks.json, and set the command tomake all"command": "make", "args": [ "all", "" ], "options": { "cwd": "${fileDirname}" }, "group": { "kind": "build", "isDefault": true } -
Press Ctrl-Shift-B to run the make all command. In the terminal, you can use Ctrl-Click on the filename with an error to navigate to it.
-
Either press F5 to start debugging, or directly edit .vscode/launch.json. It should contain:
"stopAtEntry": true, "cwd": "/tmp/01-hello-world", "program": "/tmp/01-hello-world/hello", "miDebuggerPath": "gdb", //"args": ["<", "1.in"], // If during debugging we want stdin from a file 1.in -
When pressing F5, the debugger should start and stop at the first instruction. Use Ctrl-Shift-D to activate the debug window.
-
If you have C modules, a right-click inside those modules will show the option ‘Disassembly window’.
Operation
-
You can set breakpoints by right-clicking in the left column next to the line number.
-
In the debug window (Ctrl-Shift-D), it is recommended to activate Variables, Watch, and Call Stack.
-
Variables/Locals: Displays variables from C functions.
-
Variables/Registers/CPU: Displays 32-bit registers.
-
Watch/+: Add
`print $eflagsto see the updated flags (extra backtick required, see below). -
In debug mode, right-click in the source code to open ‘Open disassembly view’.
-
In disassembly mode, you can set breakpoints in the left column next to the addresses. F10, F11, and Shift-F11 work here.
-
In the Terminal window, the program’s
stdoutandstdinare displayed. -
In the Debug Console, the GDB prompt appears. All commands at the GDB prompt must be preceded by a backtick/backquote
Example: @ vscode prompt:
`p/t $eaxinstead of plainp/t $eaxinside standalone gdb.
Hotkeys
Ctrl-Shift-DOpen debug window.F5Start debugging and continue.F10Step over - execute the entire function.F11Step into - enter functions.Shift-F11Step out - exit the current call.